Positioning System-based Medical Groups For Success

Health systems have for years been growing their employed medical groups. As of 2023, more than 77% of physicians were employed by a hospital or health system, up from 25% in 2012, according to the Physicians Advocacy Institute. The drive to employ physicians has been spurred by a desire to deliver integrated care throughout the continuum, enhance care coordination, and move upstream to help improve population health, among other things.
While this approach is generally intuitive to health system executives, the reality is most system-based medical groups are not profitable on a standalone basis — and the losses have been growing year after year. MGMA and others consistently cite median losses of $300,000 per physician (-37% margin) on a professional services revenue basis.
In the face of unrelenting financial headwinds, health system executives are increasingly asking: Why do our employed physicians lose so much money? And, more importantly, what can be done to turn the tide? The answers to these questions are multi-faceted, but there is a lot that can be done to improve the economic viability of system-based physician groups. This article launches a three-part series in which we will lay out strategies health systems can take to ensure that their medical groups drive better patient care, create a more durable clinical profession, and generate sustainable financial outcomes.
Why do system-based medical groups lose money?
Let’s start with this: independent physician groups break even or turn a profit — if they don’t, they cease to exist. Why, then, do system-based medical groups across the US lose money? And why has this been accelerating in recent years? The answer is a mix of operational, behavioral, and accounting factors. Consider what happens to an independent group as it gets acquired by a health system:
- Shifts in incentives: When transitioning into a system, physicians typically cease to operate as independent business owners who are focused on growth and productivity, and accountable to one another as partners. This dilutes physicians’ drive for patient and revenue growth since rewards are no longer directly tied to the P&L of the practice. MGMA data suggests there’s a 24% decline in production per physician FTE for an employed group — roughly 8,000 work relative value units (wRVU) versus an independent one — about 10,500 wRVU.
- Stabilized compensation: Providers typically transition into a health system because they want to focus on delivering care, not growing panels, building new practices, and otherwise building and managing a business. Health system employment is often a path to more stable practice operations, improved and predictable compensation for providers and staff, and attractive benefits. These compensation changes typically drive up costs not only for physicians but also for staff as they transition into hospital-based medical groups.
- Loss of ancillary revenues: Many independent groups administer diagnostics for their patients in their assets, including imaging, labs, and infusions. These services yield higher margins and thereby subsidize less profitable professional services. However, as part of a health system, these ancillary revenues are typically billed under centralized departments. Redirecting ancillary revenues and margins from the physician group to the health system takes a major toll on medical group revenue and profitability.
- Payer mix shifts: Transitioning into health system employment typically means physicians will care for more Medicare, Medicaid, and uninsured patients than in stand-alone clinics or private practices. Seeing these patients helps providers achieve panel and/or productivity goals, but often generates markedly less revenue for the system. On average, system-employed providers realize net revenue per wRVU of $87 compared to independent physicians with $150/wRVU, according to our review of MGMA data.
- Contracting cross-subsidization: In negotiations with payers, health systems are negotiating rates across settings, specialties, and geographies – giving in one area to gain in another. Over the past 20 years, some research suggests that physician fee schedules have effectively declined more than 20% when factoring for inflation, while hospital reimbursement has surged 70%. Anecdotally, health system reimbursements have matched these trends, offsetting increases on inpatient and procedural care with reduced growth in the professional fee schedule, all leading to further compression of medical group financials.
In our evaluation of independent and system-based medical groups across the country, these factors typically account for most of the discrepancy between profitable and unprofitable medical groups.
What can be done to stem medical group losses?
The good news is that there are several levers that health systems can pull to improve financial performance and overall profitability. These levers vary in their applicability and magnitude, but they are broadly applicable to many system-based medical groups. Below we list the key levers in order of immediacy:
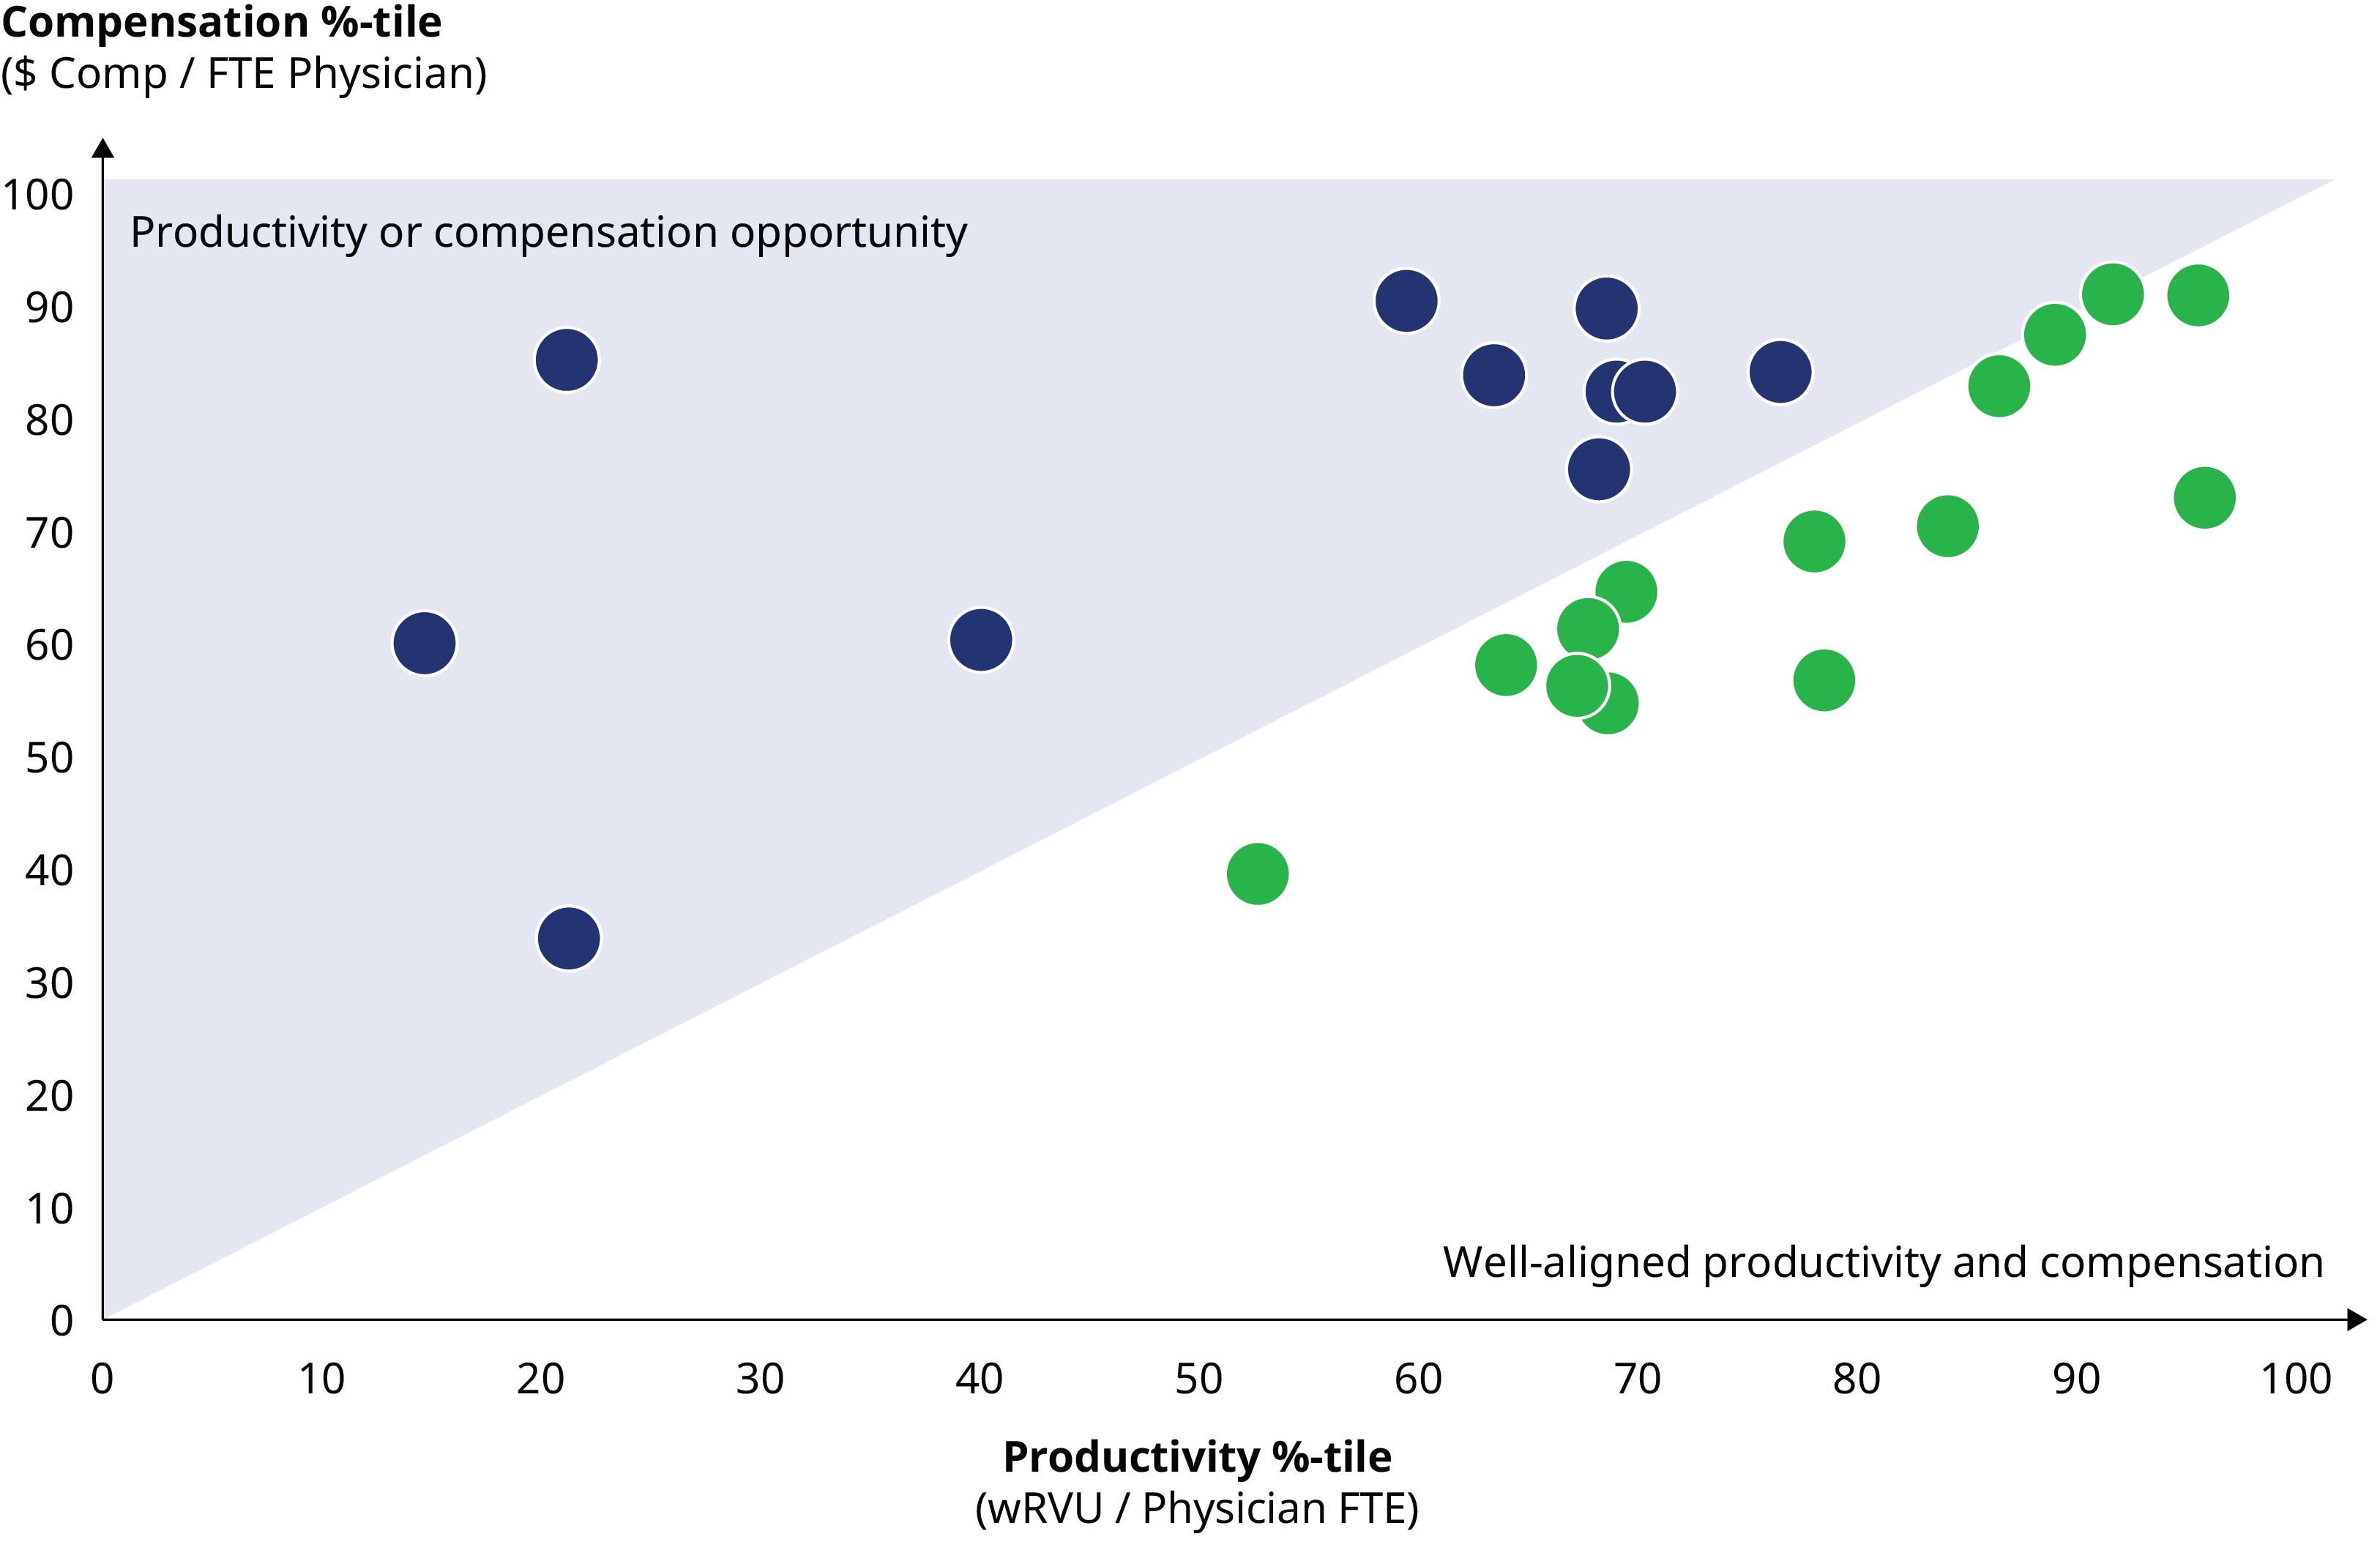
- Connecting productivity to compensation: While all groups pay attention to productivity, more financially accretive groups motivate growth and asset productivity through expanded hours and extended care teams. Additionally, they pay close attention to managing their payer mix. Good models ensure that compensation is commensurate with production, as measured in terms of panel size, wRVUs, and professional service revenue.
As the graphic below demonstrates, no compensation model is perfect; some providers will still be over-paid while others are under-compensated. However, adjusting the compensation model to limit outliers can drive better financials and maintain Fair Market Value compliance. This graph illustrates the alignment of physician productivity with compensation. Physicians in the upper left triangle receive compensation that exceeds wRVU productivity, indicating a need to either review compensation or stimulate productivity.
- Raising Physician Performance: Stimulating (or removing) lower production physicians can produce an immediate financial boost — increasing revenues while accruing only the associated direct variable expenses. Hence, marginal increases in productivity in the bottom quartile of a group can generate substantial financial gains. Similarly, we have found that providers often fail to bill for transitional and care management services that are covered by their contracts. Converting these activities to revenue can be as simple as paying attention. In other instances, we have seen groups emphasize productivity measurement, create provider-to-provider accountability, and rewire operational processes to improve clinical flows and access.
- Adding Care Team Leverage: Increasing the production of any one clinic relies on having more providers with more schedulable hours. Often one of the fastest ways to grow clinic production is through expanded care teams that incorporate advanced practice providers. Leading systems and medical groups are pushing toward 1:3 and 1:4 MD to APP ratios, and they are vastly expanding access for their communities. These strategies have proven to be transformational: they open up access, improve patient and provider satisfaction, and are financially accretive.
- Optimizing Support Staff: Staffing clinics has become more difficult in the wake of COVID. Opportunity rests, however, in finding ways to enable these scarce resources to have an even greater impact via automation and process redesign. We have found meaningful improvements are possible when engaging these team members in rethinking many baseline functions of a clinic and incorporating technology to automate and/or expedite work.
- Consolidating Rooftops and Front Doors: Many system-owned groups retain a distributed network of acquired clinic sites, missing opportunities to achieve real estate and staffing synergies. Further, co-location often creates opportunities to integrate and better coordinate patient care. Given lead times associated with real estate planning, having a clear line on opportunities to consolidate close-by and duplicative sites, or downsize unused office space, can yield additional savings.
- Capture Value-based Revenue: There are many opportunities to enhance revenue by rotating toward value- and risk-based contracts. This is not to say providers must take on substantial amounts of risk. Rather, we have found that many providers are often unaware of value-based incentives already in place, frequently fail to bill for services they are rendering, and dismiss and/or under resource processes to ensure revenue and coding accuracy. In aggregate, these levers can add a substantial amount of unclaimed revenue and incentives on another fixed cost base.
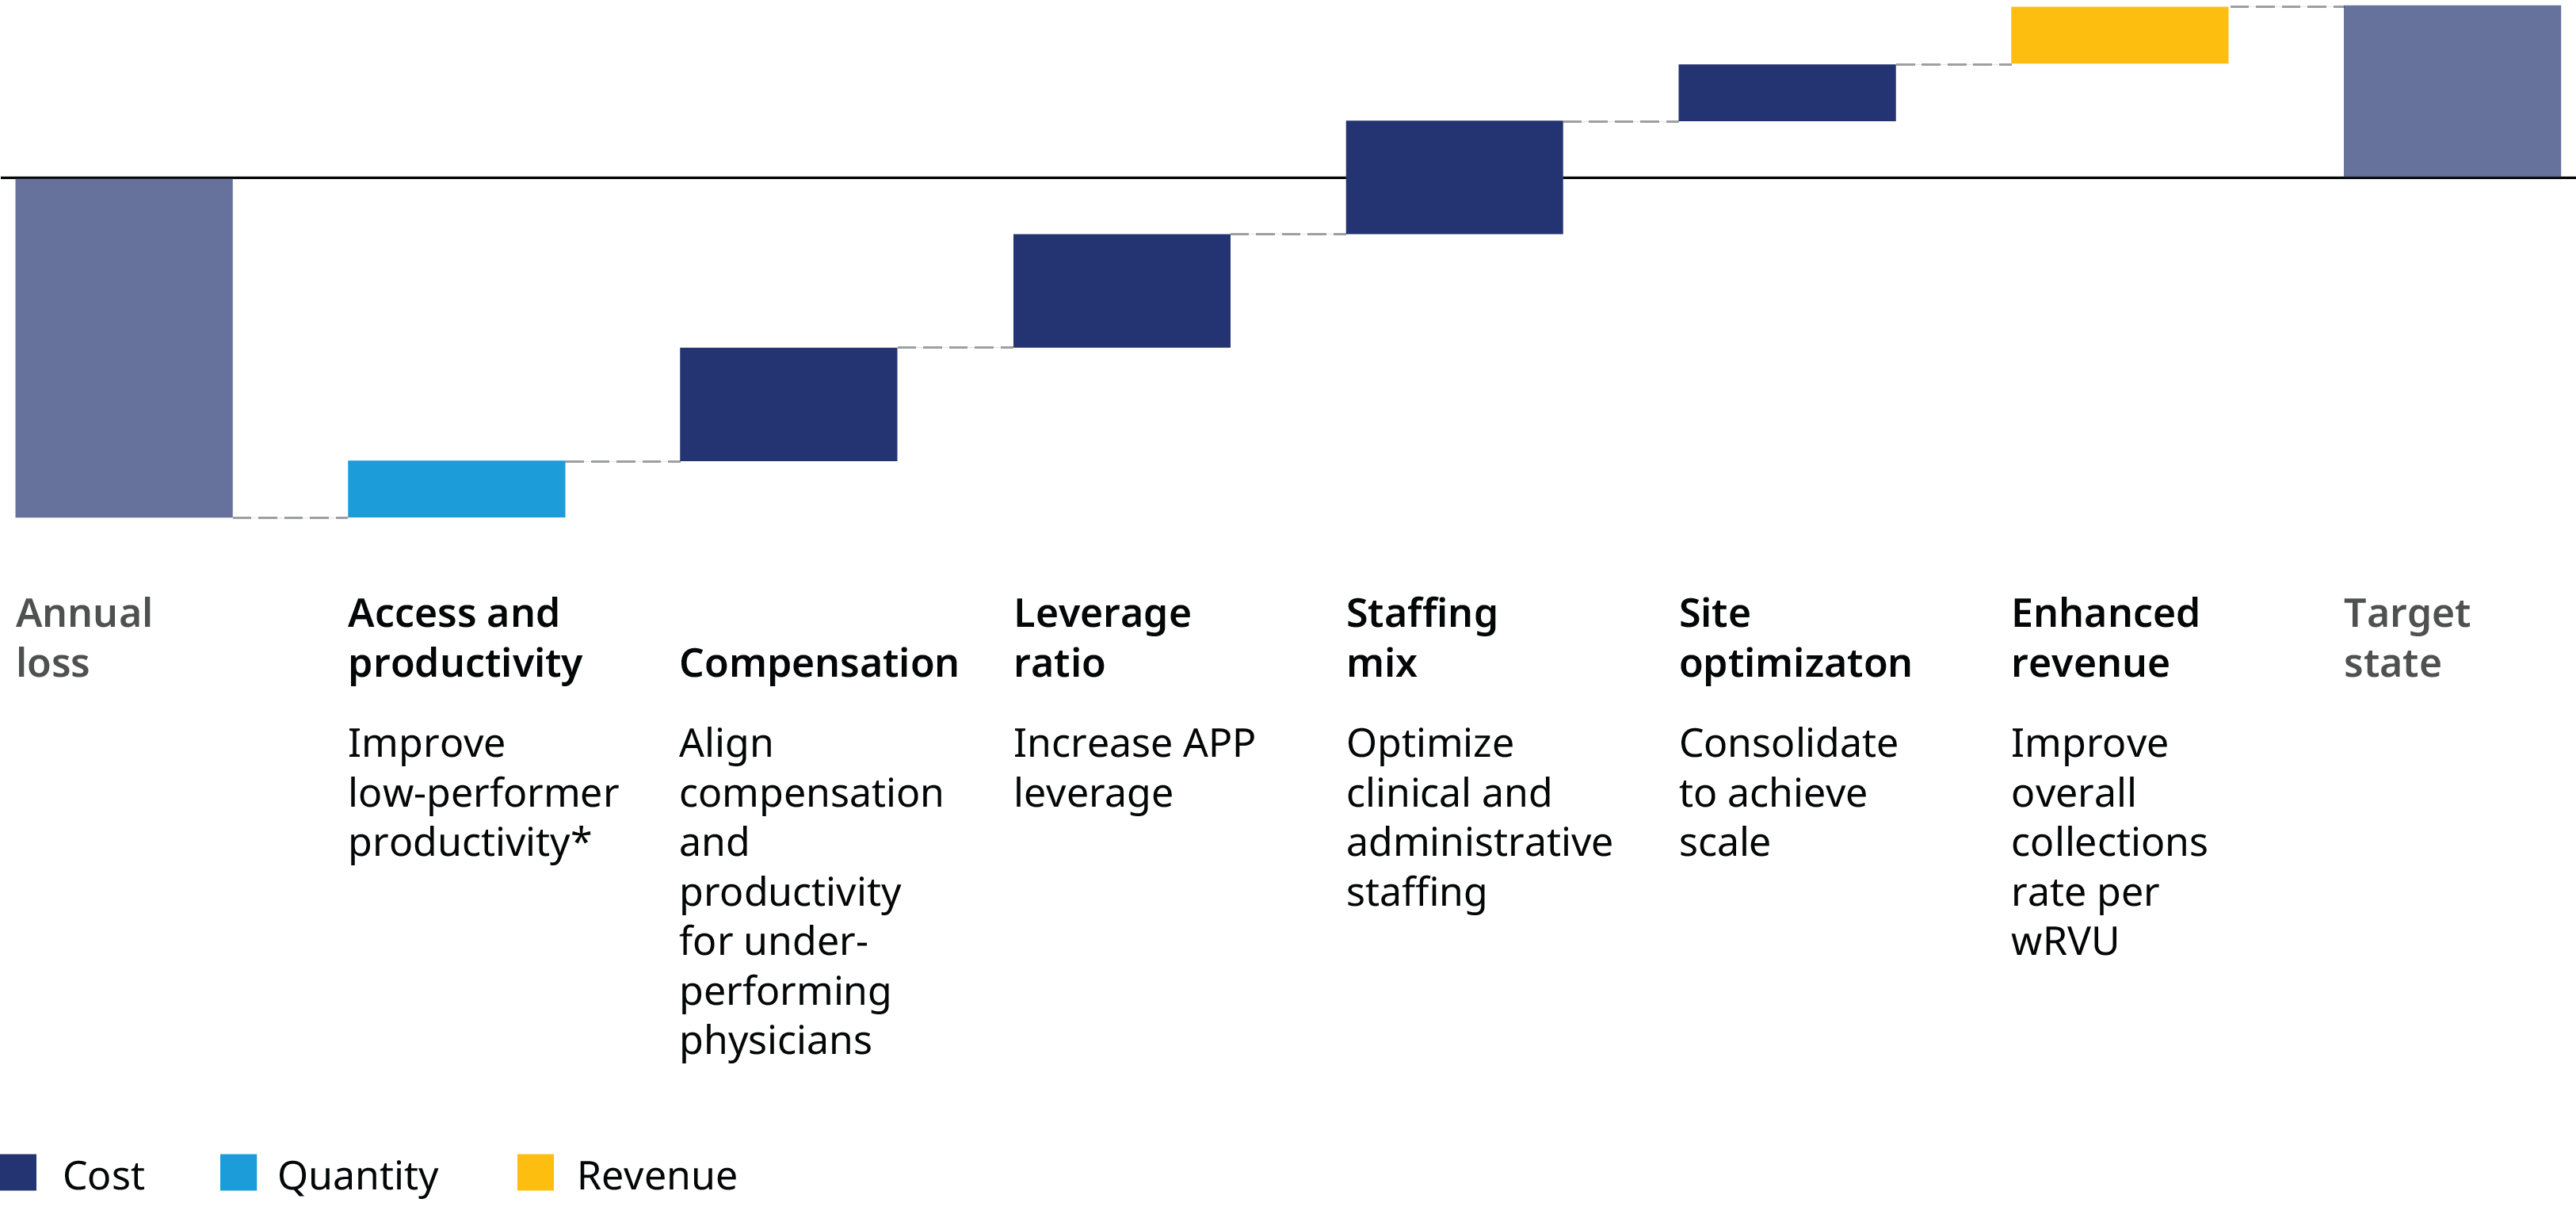
Putting these levers to work, a medical group can see significant improvement in its financial performance, as depicted in the exhibit below:
It’s critical that health system executives methodically evaluate and address core operational issues to position their medical groups for growth and success. To be sure, these adjustments require time — along with strong leadership, communication, and change management. The groups that have pushed down these paths, though, have realized patient growth, better access, and more fulfilled and durable clinical practices.
The next article in this series will explore how medical groups can be better integrated with the parent health system to drive growth.