Following an in-depth review of large public health insurance companies, we assessed the profitability of their insured blocks of business. The results showed a general stability in profit margins from Q2 2023 to Q3 2023, and from Q3 2022 to Q3 2023. This decrease in margin is mainly attributable to increased operating expenses during Q3 2023. Below we break down the key insights from our review.
Net income trends — insured business
Elevance (Anthem) saw the biggest decrease in profit margin among the large public companies from Q2 2023 to Q3 2023, dropping by 1.2% primarily due to increased operating expenses in Q3 2023. CVS Health (Aetna) also saw a decreased profit margin in Q3 2023 compared to Q2 2023, dropping by 0.1%. Both companies also saw a reduction in their margins when comparing Q3 2023 to Q3 2022.
Cigna’s and UnitedHealthcare’s profit margins both increased in Q3 2023 compared to Q2 2023, by 0.4% and 0.2%, respectively. Overall, the unweighted average profit margin of 5.0% is 0.2% lower than the Q2 2023 unweighted average, and 0.6% lower than the Q3 2022 unweighted average of 5.6%.
Medical loss ratio
On average, the medical loss ratios for all four of the public large companies that we reviewed were 0.4% lower from Q2 2023 to Q3 2023. In Q3 2023, reported loss ratios were 86.8% for Elevance (Anthem), 85.7% for CVS Health (Aetna), 82.3% for UnitedHealthcare and 80.5% for Cigna. Similar to profit margins, loss ratios are impacted by seasonal patterns. Overall, the unweighted average loss ratio was fairly consistent with, but slightly higher in Q3 2023 at 83.8% compared to Q3 2022 at 83.3%.
Estimated operating expense ratio
Overall, operating expense ratios increased by 0.7% from Q2 2023 to Q3 2023. All companies reported increases in operating expense ratios, led by Elevance (Anthem), whose operating expense ratio increased 1.7%, while the other companies saw smaller increases in the quarter. United Healthcare (0.1%), CVS Health (Aetna) (0.5%), and Cigna (0.6%). The Elevance increase was associated with a non-recurring “business optimization charge” per the company’s earnings release.
Earnings highlights: Q3 2023 earnings releases and call transcripts
UTILIZATION
Many carriers commented on the utilization trends they have seen during Q3 2023 noting that overall utilization is generally in line with expectations.
- Centene: Health benefits ratio for the quarter was 87%, which is better than their internal forecast. Breaking it down by line of business, Centene noted that they experienced health benefit ratios of 78.9% within Commercial, 82.2% within Medicare, and 90.7% within Medicaid. Commercial experience was better than expectations and is driving the favorable consolidated health benefits ratio. Medicaid experience was roughly 40 basis points worse than expectations, but management believes this is due to a timing matter that is expected to be resolved.
- CIGNA: Medical care ratio was better than expectations in the quarter at 80.5%, driven by favorable medical care ratios in the US Commercial business. Overall, CIGNA believes the year-end 2023 ratio to be in the range of 81.5% to 82.0%.
- Elevance (Anthem): Experienced a benefit expense ratio of 86.8% within the quarter, an improvement of 40 basis points compared to the third quarter of 2022, driven by premium rate adjustments to cover medical cost trend and solid performance within their government business.
- Humana: Experienced an insurance segment benefit ratio that exceeded expectations by 40 basis points due to higher medical costs in the Medicare Advantage business. The increased Medicare Advantage benefit ratio is primarily based on increased inpatient COVID-19 admissions in Q3 2023, which is earlier than had been anticipated. Expect full-year 2023 benefit ratio to be roughly 87.5%, which implies a fourth quarter benefit ratio of 89.5%.
- Molina: Medical cost ratio in the quarter was 88.7%, moving the year-to-date ratio to 87.8%. Medicaid business experienced a medical cost ratio of 88.8%, in line with expectations. Medicare Advantage saw a medical cost ratio of 92.4% which is above their long-term target range and impacted by higher-than-expected utilization of outpatient, professional, and in-home services, all of which they believe were appropriately addressed in 2024 bids. The medical cost ratio for Molina’s Marketplace business was 78.9% in the quarter which reflects the enhanced focus on silver and renewal members to help drive strong performance and risk adjustment.
- UnitedHealth Group: Care patterns remain consistent with the view shared during the second quarter, with activity levels still led by outpatient care for seniors and still most notably in the orthopedic and cardiac procedure categories. They expect their full year medical care ratio to be toward the upper end of their initial 82.6% estimate, plus/minus 50 basis points.
Membership — commercial and Medicaid, including impact of Medicaid redeterminations
In Q3 2023, total Medicaid membership for public carriers decreased by 4.5% from Q2 2023, driven by continued redetermination of Medicaid eligibility, however, total Medicaid enrollment is still over 37% higher than at the beginning of the pandemic. Total commercial membership increased roughly 0.5% over Q2 2023, as some individuals who lost Medicaid coverage were able to shift to commercial coverage.
During their earnings calls, most carriers provided insight into their year-to-date membership performance. In addition, some carriers also commented on the ongoing process of states redetermining Medicaid eligibility. The Public Health Emergency officially ended on May 11, 2023 with several states beginning the redetermination process on April 1, 2023.
- CIGNA: Ended the quarter with about 19.6 million medical customers, representing growth of 1.6 million members since the end of 2022, driven by an 13% increase in Medicare Advantage enrollment and an 8% increase within the Commercial market.
- Elevance (Anthem): Ended the quarter with medical membership of 47.3 million members, reflecting a 664,000-member decrease in the quarter driven by Medicaid membership losses, but a 42,000-member increase year-over-year.
- Humana: Expect to end the year with at least 860,000 more Medicare Advantage members than at the end of 2022 which reflects a 35,000-member increase relative to the projections at the end of Q2 2023.
- Molina: Medicaid enrollment decreased by 200,000 members in the quarter due to the net impact of Medicaid redeterminations. Year-to-date Medicaid enrollment is down 300,000. Molina estimates that 70% of individuals disenrolled from Medicaid have been due to procedural reasons as opposed to verification of actual ineligibility and have been able to re-enroll 30% of those members and expect to continue to re-enroll members who have lost Medicaid coverage.
- UnitedHealth Group: Commercial enrollment has increased by nearly 700,000 enrollees year-to-date. In addition, they still expect to add almost 1,000,000 Medicare Advantage members by the end of the year.
The chart below displays the changes in reported enrollment for the 15 most recent quarters for commercial and Medicaid for a set of public companies where counts were available on a consistent basis. In the quarter, total commercial membership increased by 461,000, while Medicaid membership decreased by approximately 2,003,000 in the quarter due to the redetermination process.
Market capitalization corner — capitalization of health plans through Q3 2023
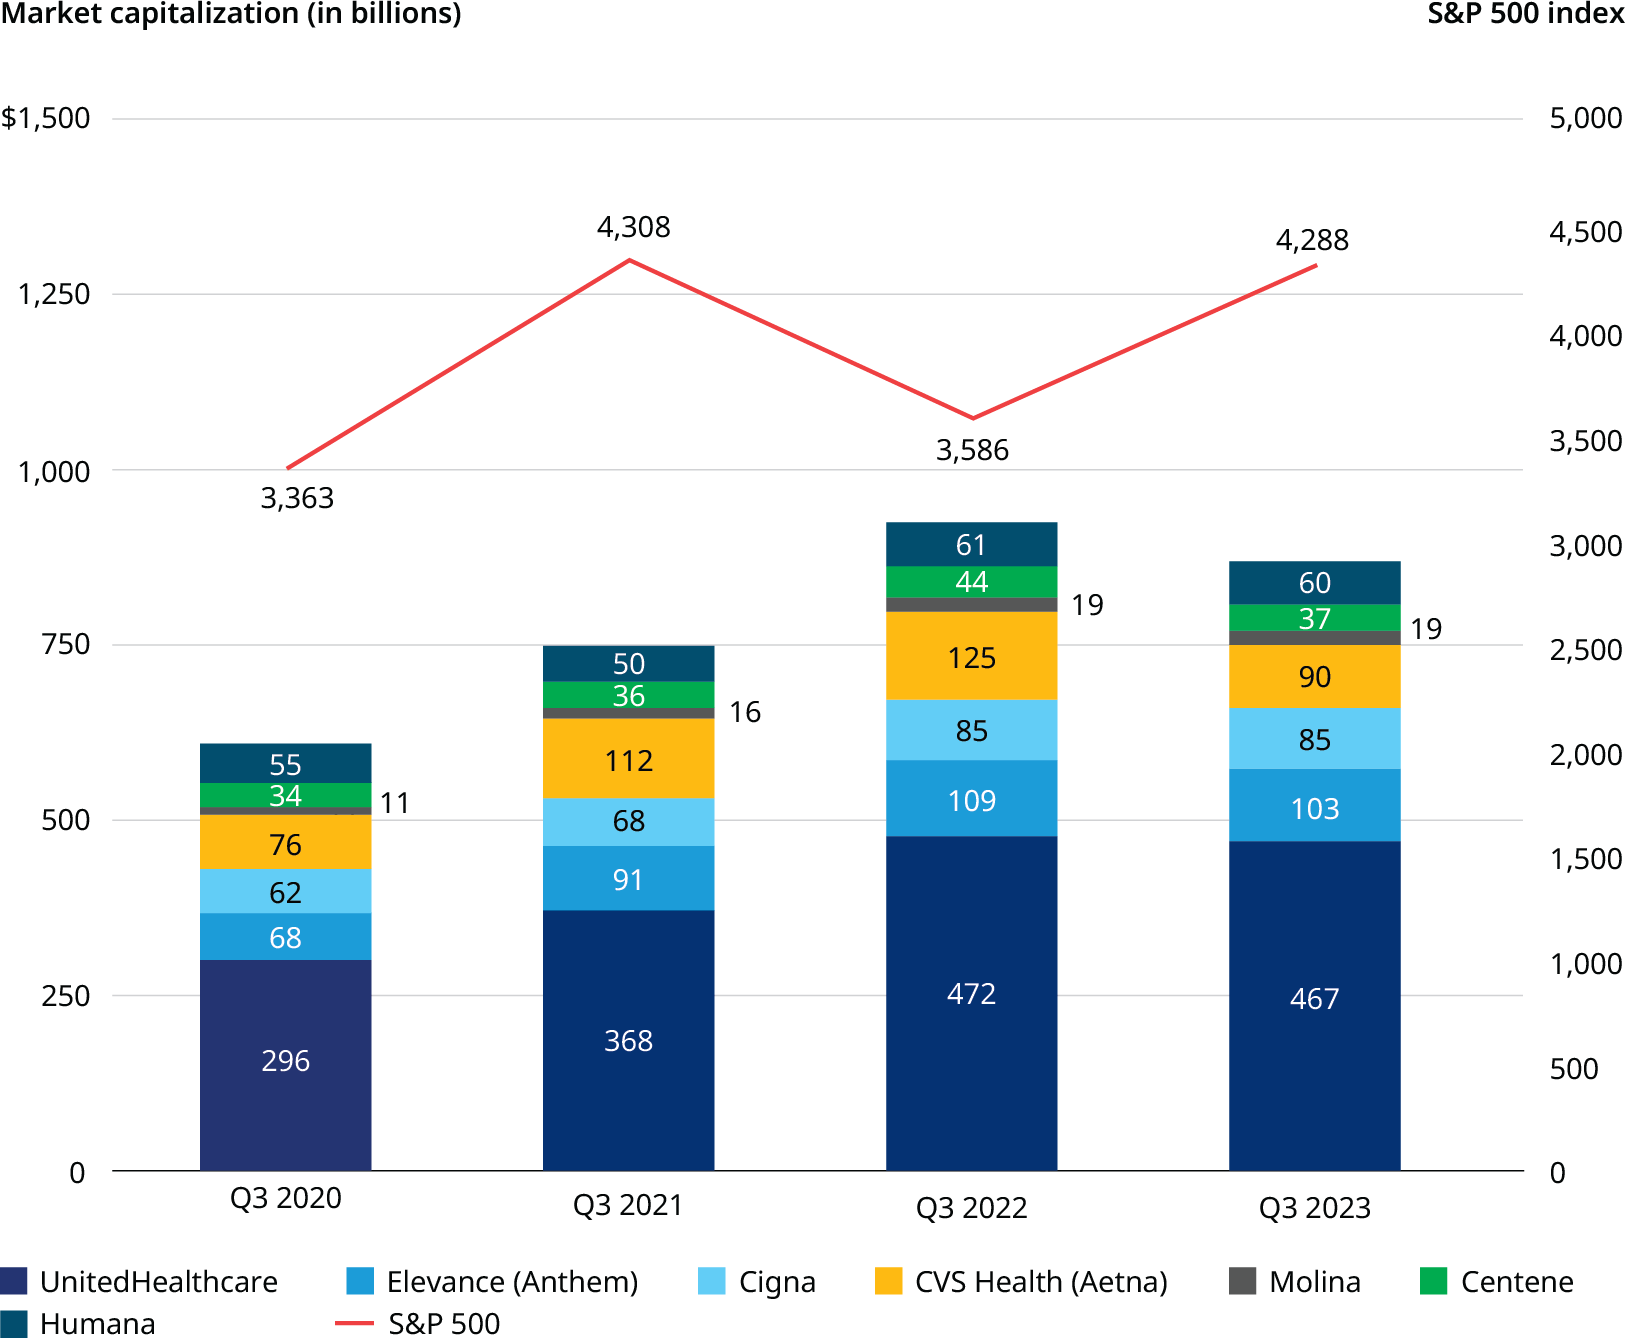
YEAR-OVER-YEAR CHANGES IN MARKET CAPITALIZATION 2020-2023
From Q3 2020 to Q3 2023, the collective market capitalization of the seven public healthcare companies we track saw considerable growth. Between September 30, 2020 and September 30, 2023, the aggregate market capitalization of the seven public health plans rose by 43.0%. During the same period the S&P 500 index (SPX) saw growth of 27.5%; 15.5% less than that attained by the seven tracked public healthcare companies. However, despite the substantial overall gain by the health plans, there has been a noticeable decrease in market capitalization over the last year. From Q3 2022 to Q3 2023, the market capitalization of the seven public companies dropped by 6.1%. Contrarily, the S&P 500 index (SPX) increased by 19.6% from Q3 2022.
Q2 2023 Versus Q3 2023 MARKET CAPITALIZATION
The S&P 500 index reported a slightly bearish quarter with a 3.6% drop from Q2 2023’s market capitalization. Alternately, of the 7 tracked public healthcare companies, six companies reported gains in market capitalization over the same period. Molina had the most growth in its market cap with an 8.8% increase and Humana followed closely with an increase of 7.9%. UnitedHealthcare reported an increase of 4.4% while Cigna, CVS Health and Centene’s growth was fairly with flat increases at or below 2% of 2.0%, 1.2% and 0.8% respectively. The only company to show a decline in market capitalization from Q2 to Q3 2023 was Elevance (Anthem), with a decline of -2.6% which was lower than the drop in the S&P 500 index, showing the strength and resilience of healthcare companies when the market is underperforming.