We are excited to share with you volume 11 of our health insurer financial newsletter, Pulse! Our aim is to keep you abreast of key market trends and dynamics that impact health insurer financial results and profitability.
Earlier in the year, we released part 1 of our newsletter, which included large public companies’ Q4 2022 financial performance and earnings highlights. The complete Pulse Volume 11 includes reported statutory financial experience for health insurers through Q4 2022, medical loss ratio (MLR) rebate trends, Q1 2023 public companies’ financial statements, and a summary of recent health plan mergers and acquisitions (M&A) activity and valuation trends. Explore the key highlights below and download our newsletter for more details.
Q4 2022 statutory financials — individual, group, Medicare, and Medicaid markets
Pre-tax profit margins in 2022 increased for all type of companies following decreased margins in 2021. Public companies increased by 0.5% over full-year 2021. For Non-Public Blues, margins increased by 0.4%. For other health carriers, the reported 2022 margin increased by 1.1% and moved back into positive territory at 0.7%.
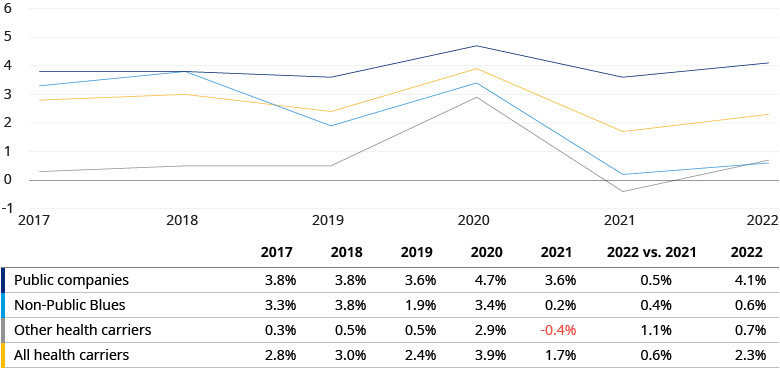
Overall, pre-tax margins for all markets increased from 2021 to 2022 by 0.6% to 2.3% driven by slightly decreased loss ratios. This 2.3% margin is reasonably close to the pre-COVID average from 2017 to 2019 of 2.7%.
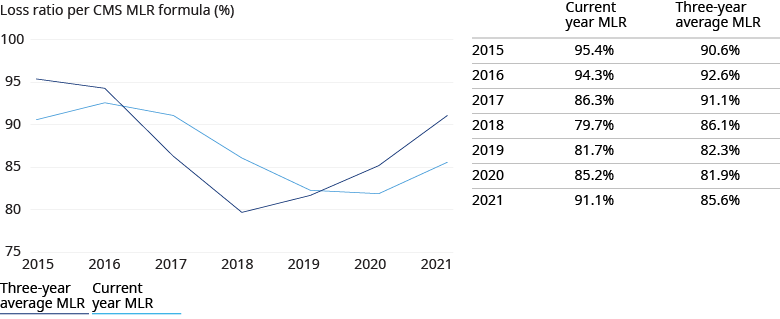
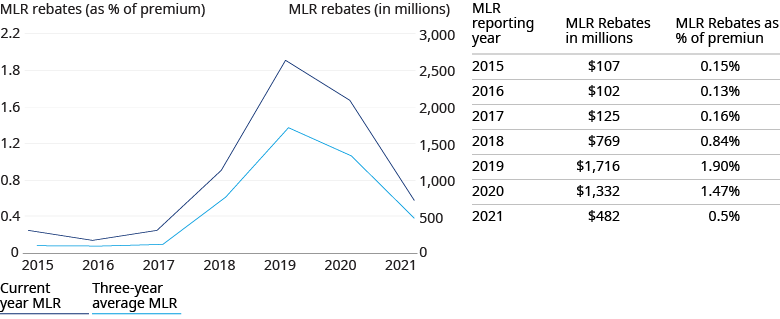
MLR rebate trends in the individual market
We reviewed the MLR rebate public user files for the 2021 reporting year and note that the three-year average MLR increased in 2021, going from 81.9% as of year-end 2020 to 85.6% as of year-end 2021. MLR rebates decreased substantially from $1.3 billion payable in 2021, or about 1.5% of premium, to $482 million payable in 2022 (based on the 2021 Reporting Year), or about 0.5% of premium. In 2021, higher claims experience was offset partially by lower taxes. This increased the current year MLR from 85.2% in 2020 to 91.1% in 2021.
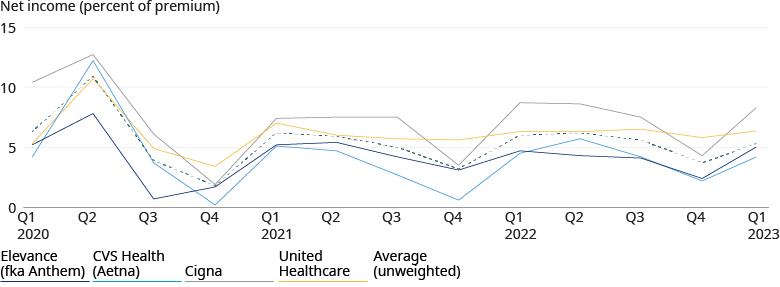
Q1 2023 public companies’ financial performance
We reviewed Large Public Companies’ profitability for their insured business and noted that reported profit margins increased from Q4 2022 to Q1 2023, in line with seasonal patterns where Q4 profits tend to dip due to the seasonality of claims and higher administrative expenses late in the year (for example, open enrollment costs for Affordable Care Act (ACA) and Medicare Advantage (MA) business), and premium increases are often seen at the beginning of the year. Relative to Q1 2022, Q1 2023 margins were fairly consistent overall.
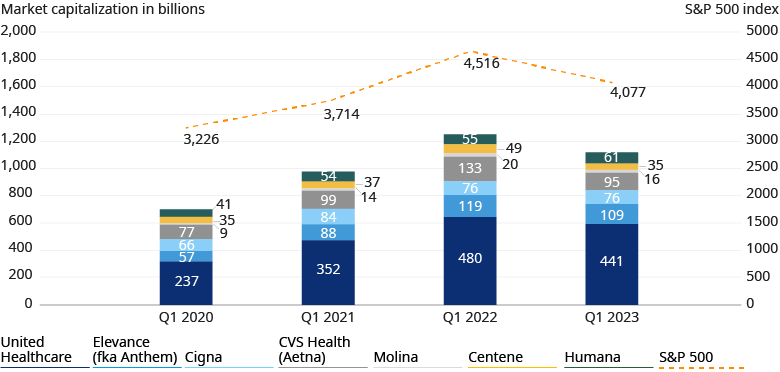
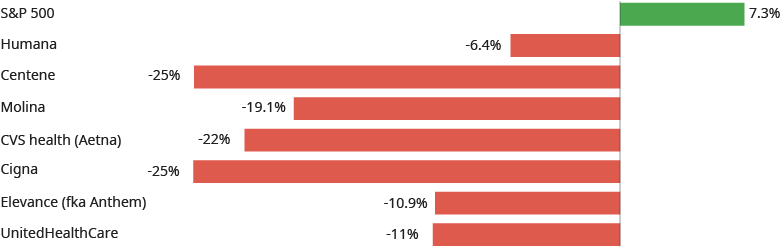
Health plans — market capitalization trends
From 2020 to 2023, the collective market capitalization of public healthcare companies has seen considerable growth. Between March 31, 2020, and March 31, 2023, the aggregate market capitalization of the seven public health plans we track rose by 59.5%. During the same period the S&P 500 index (SPX) saw growth of 26.4%, less than half of that attained by the seven public healthcare companies. However, despite the substantial overall gain, there was a noticeable loss in market capitalization over from Q1 2022 to Q1 2023 when the S&P 500 index dropped by 9.7%, and the seven public companies roughly mimicked the market and dropped by 10.6%.